21 tools for Real User Monitoring (2022 version)
Published 24 October 2020 14:24 (6-minute read)
When you search online for Real User Monitoring you'll see a lot of companies that offer the RUM service. But where do you start when searching for the solution you need. In this post, I'll list the different solutions there are on the market.
First, I hope everyone knows what Real User Monitoring is. If you don't know it yet, please read my "What is Real User Monitoring" post.
It's important to have a good solution for collecting the user experience for real user monitoring. Therefore, you want a SaaS solution (or your own data collection tool) that you can use with ease. You don't want to spend months setting up real user monitoring, then collecting the data, and after that improving your website. You want to start immediately, your time is valuable and you want to improve it as soon as possible.
In the last years, I was spending more and more time validating the user experience of the visitors. This year I was done with testing, so I decided to look for a quality tool that could help me with Real User Monitoring. Therefore, I created this list with possible tools you could use.
Do you want to measure the user experience of real users? That's Why is the new way of collecting RUM data in a privacy friendly way.
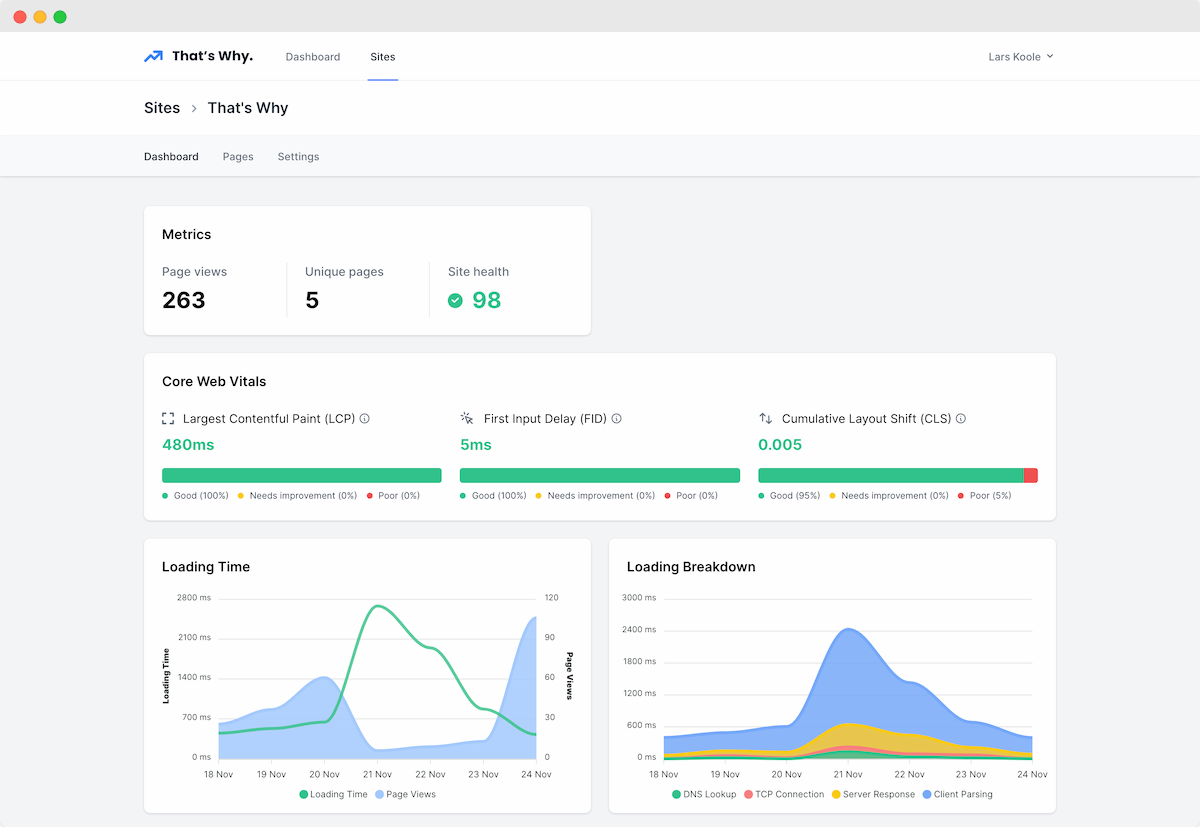
That's Why
- Monitor your slow pages
- See which countries need improvements
- See which device types (mobile, tablet, and/or desktop) need improvement
- Filter your stats in the dashboard
- Informational alerts based on real-time events
- Can be used with Synthetic Monitoring
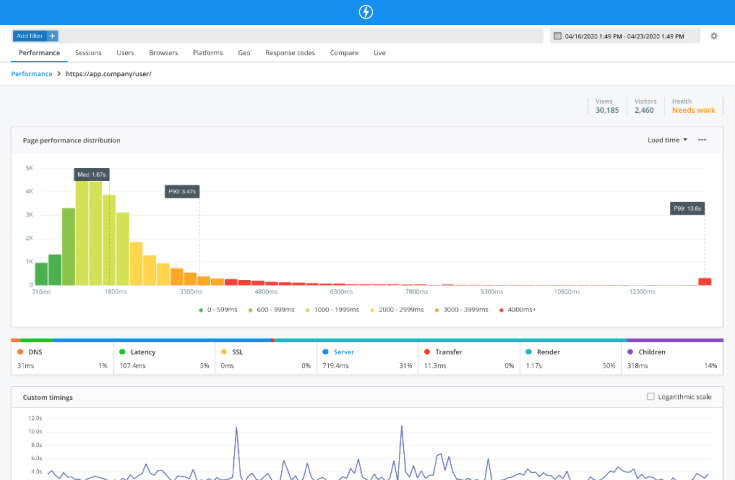
Do you want to learn more about Real User Monitoring or Synthetic Monitoring? That's Why is a SaaS solution for Real User Monitoring and Synthetic testing. That's Why focuses on providing relevant advice for website owners, marketers, and developers to improve website user experiences. The main benefit of That's Why is privacy, it doesn't track users, only collects information about the browser loading time.
Take a look at That's Why, a real user monitoring tool.
This is a project where I'm working on with the team of Astronatic.
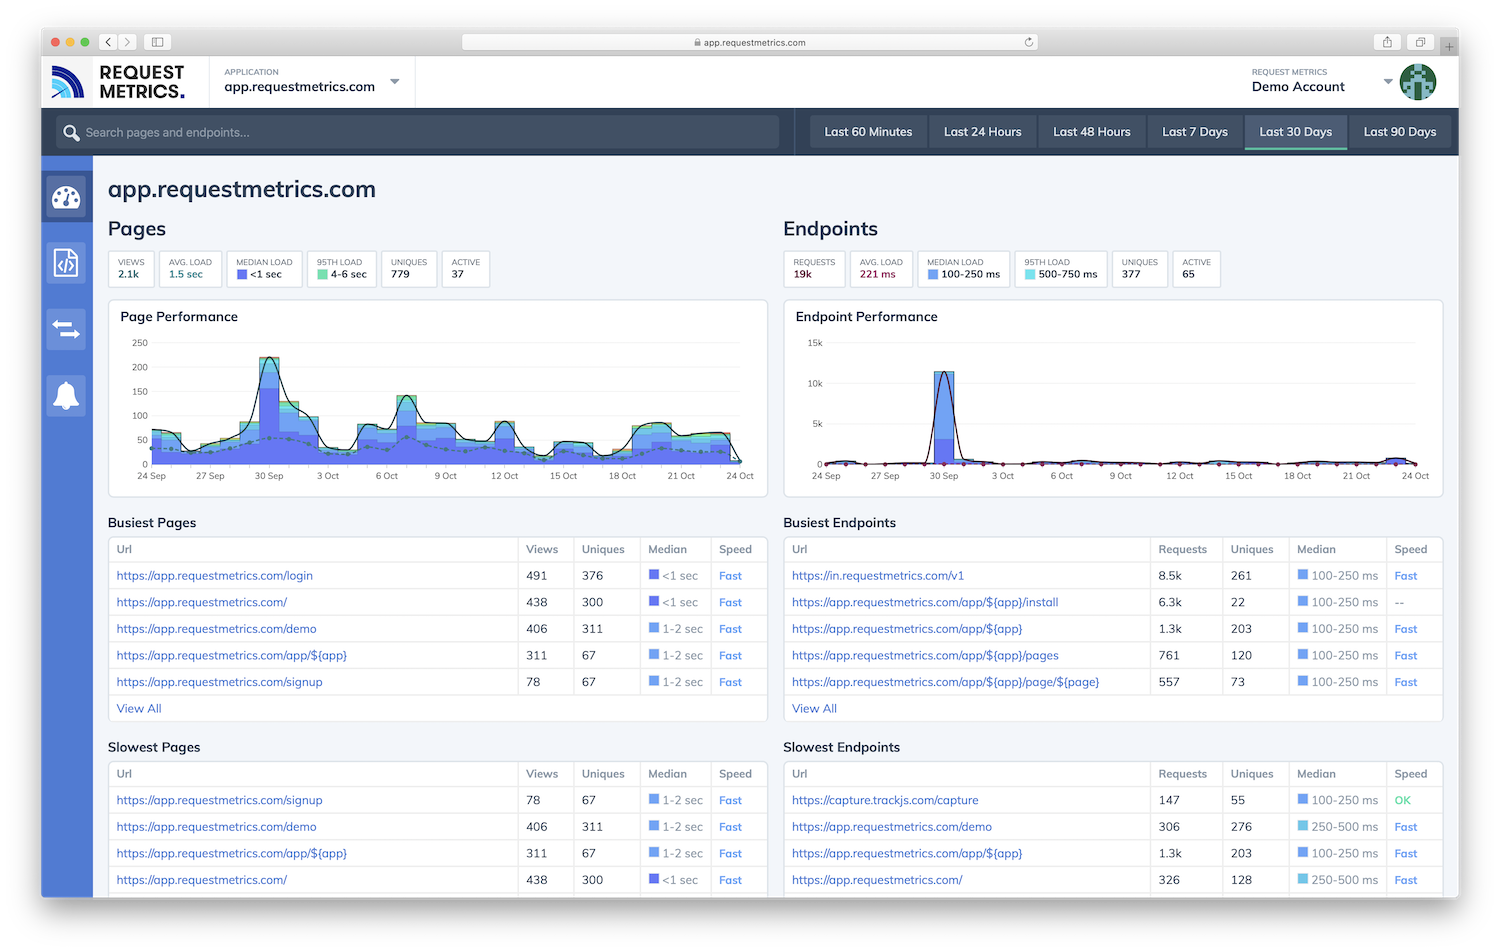
Request Metrics
- Core Web Vital Metrics
- Simple Reports & Alerting
- Web Vital Performance Metrics
- See What's Making Your Pages Slow
Take a look at Request Metrics.
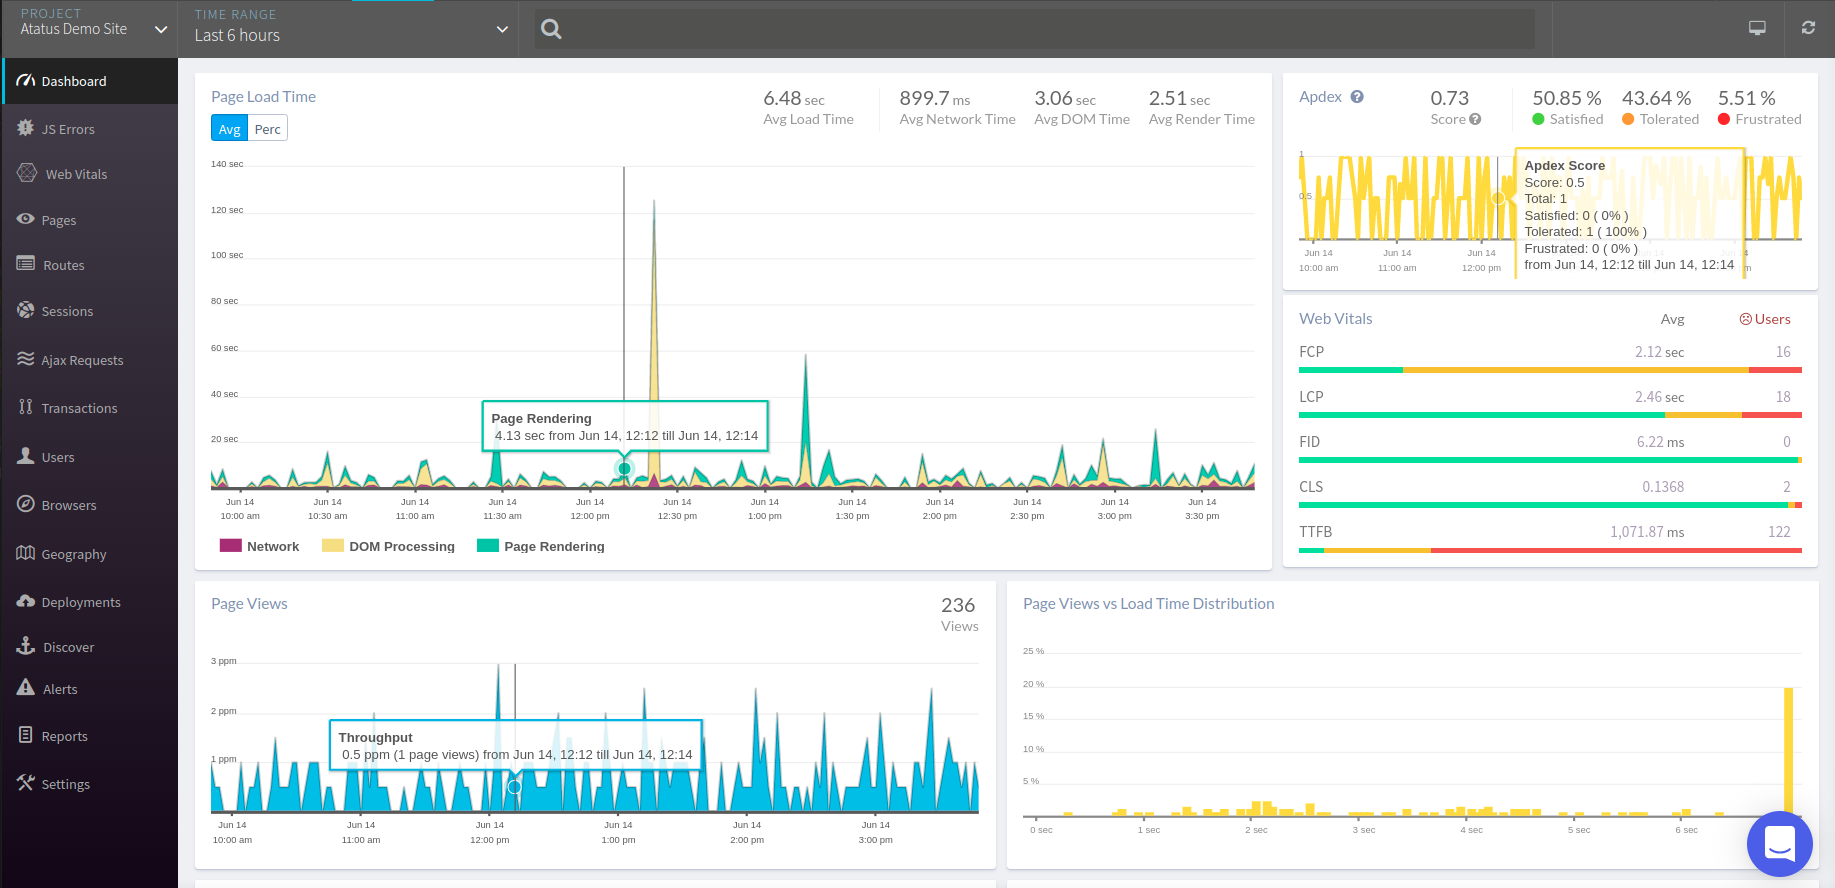
Atatus
Full Stack Monitoring Tool provides insights into problems across your infrastructure in real time.
Take a look at Atatus.
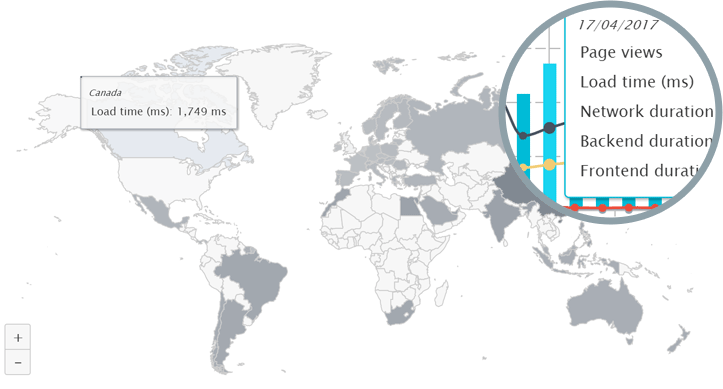
Uptrends
- Website speed per country
- Load time breakdown per dimension
- Pageviews vs performance
- Can be used with Synthetic Monitoring
Take a look at Uptrends.
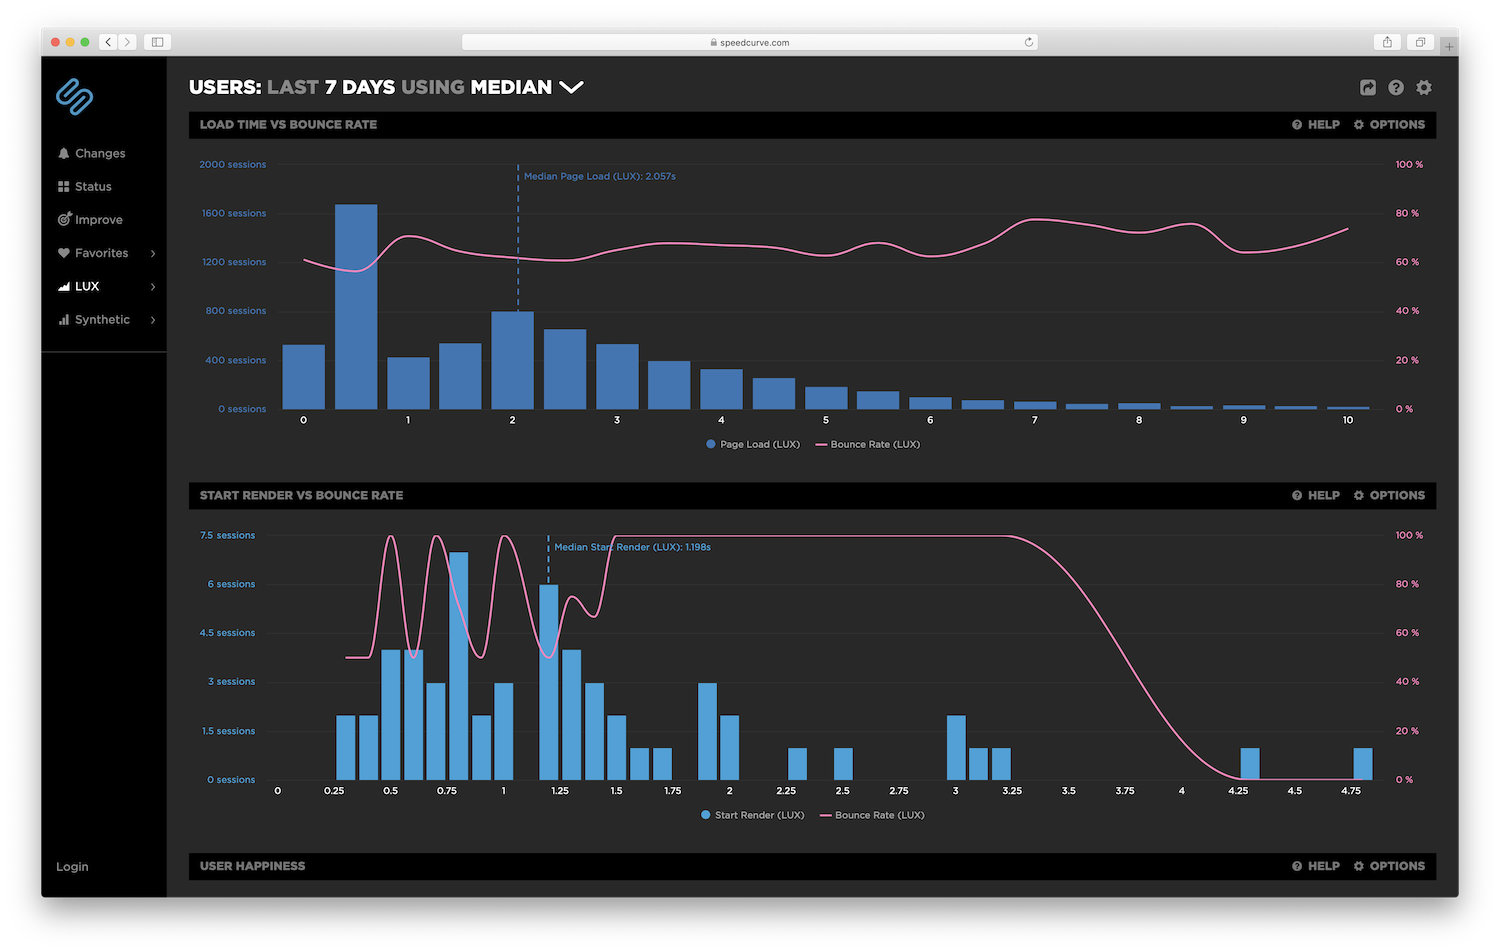
Speedcurve
- Correlate performance with user experience
- Track the impact of performance on business metrics
- Measure what matters most on your pages
- Learn when users begin to interact with your pages
- See the impact of design changes on performance
- Create and share custom charts and dashboards
- can be used with Synthetic Monitoring
Take a look at Speedcurve.
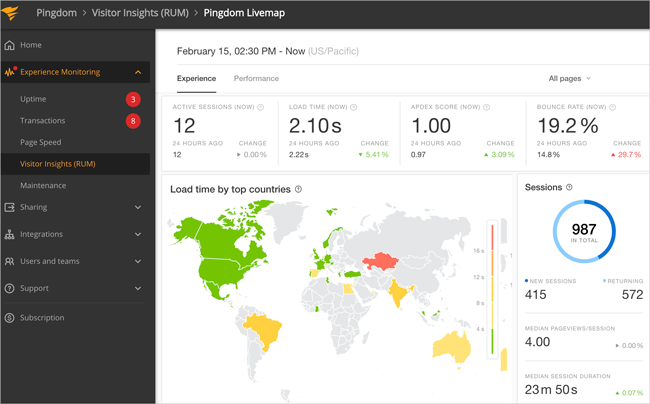
Pingdom
- Visual geographic hot spots with live mapping
- Insights into user behaviors and platforms
- Granular visibility with advanced filtering
- Summary of key performance and usage metrics, now and over time
- Easily sharable user insight reports
- Can be used with Synthetic Monitoring
Take a look at Pingdom.
Sematext Experience
- Find slow-loading pages
- Support for Single Page Applications
- Monitor Your Apdex Score
- Get Real-time Automatic Alerts
- Map Out Business Journeys in Real-Time
- Combine the Power of Metrics, Logs, and Real User Monitoring Under One Roof
Take a look at Sematext Experience.
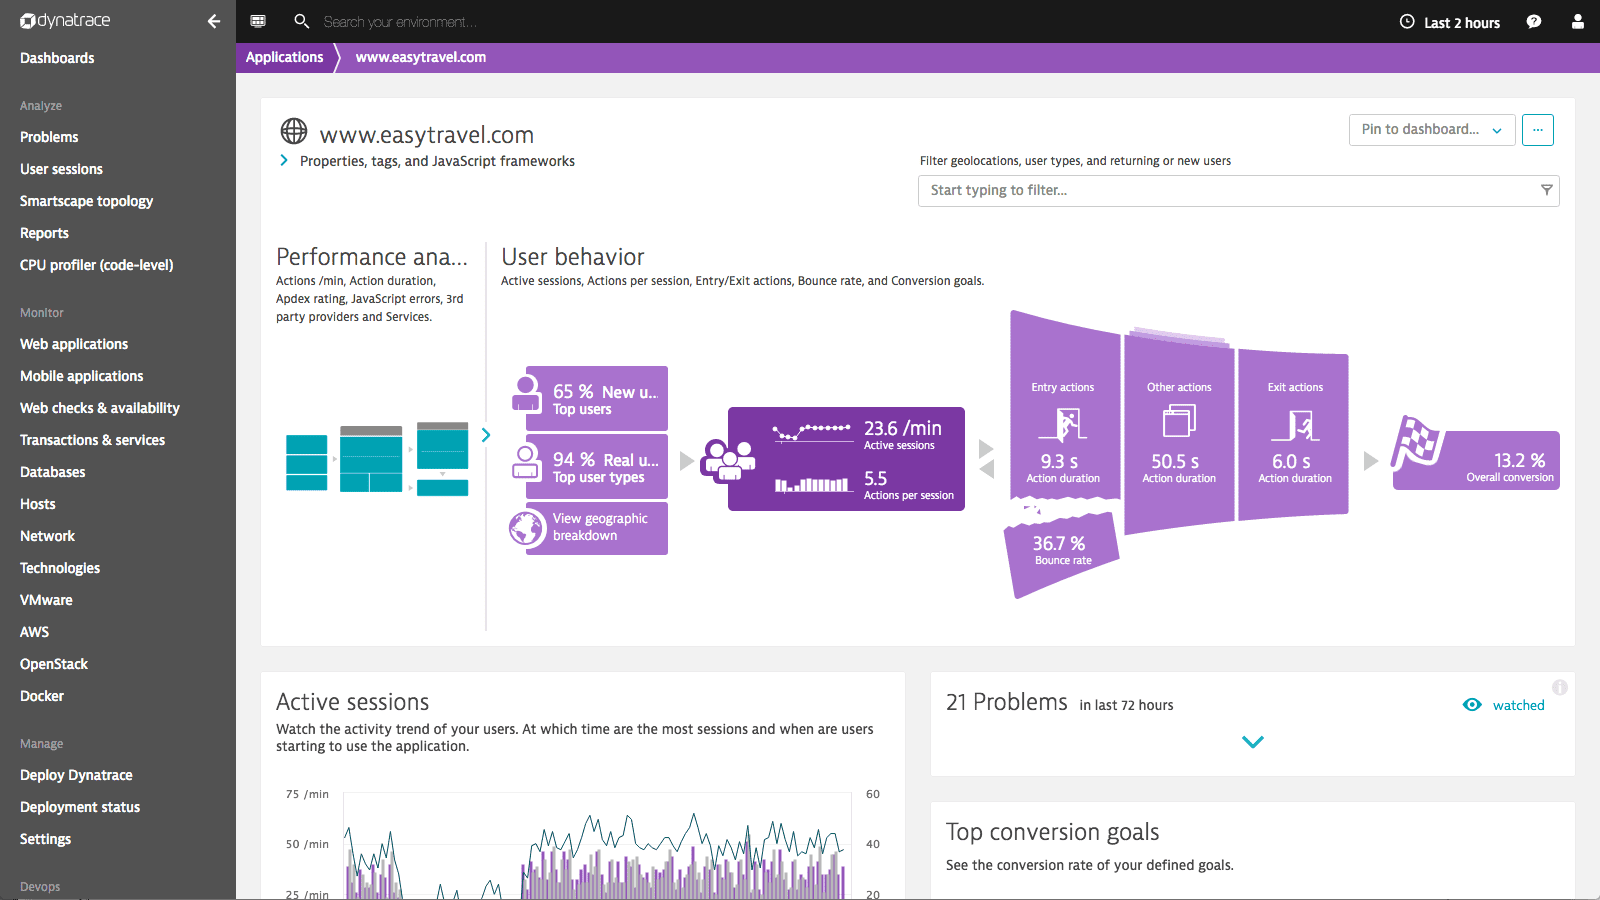
Dynatrace
- Monitor user journeys
- Identify and resolve technical issues proactively
- Drilldowns for data analysis
Take a look at Dynatrace.
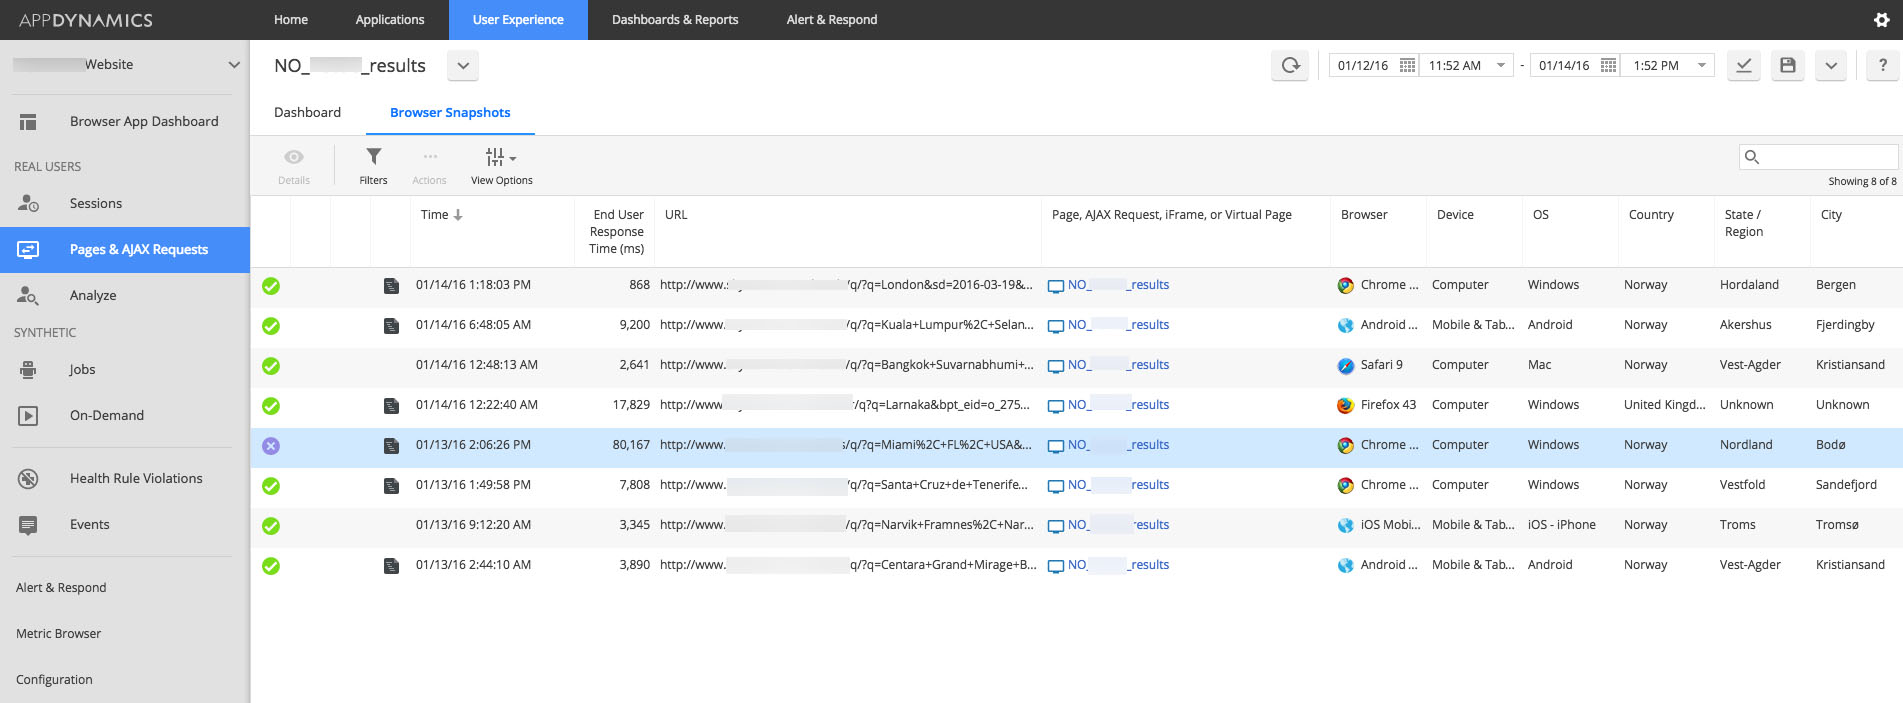
AppDynamics Browser
- Understand end-user experiences across the globe, in real-time
- Get accurate browser-user insights to optimize web experiences
- Drill down into individual user experience to respond quickly and resolve web app/site performance issues
Take a look at AppDynamics Browser.
New Relic Browser
Information is coming soon...
Akamai mPulse
Information is coming soon...
Raygun
Raygun RUM is probably one of the more established tools in this list, with customers like Avis, Samsung, and Domino's Pizza on their list of customers and a leader award on review site G2 Crowd. Raygun's focus is providing an actionable way to measure the impact of your front-end performance on real users. Features include:
- Support for web, mobile, and SPAs.
- Key contextual information about the request, like the geography, browser, device, and operating system.
- See which assets are loading the slowest with a full waterfall breakdown of load times across DNS, latency, SSL, server, and transfer times.
- View a list of XHR requests made from that page and how long each one took to respond.
- Filters your performance across different browsers, geographies, and more.
- Get set up in minutes with our lightweight SDKs.
With Real User Monitoring software starting at just $8 per month, it's an affordable way to monitor real user sessions.
Monitis
Information is coming soon...
Sentry performance monitoring
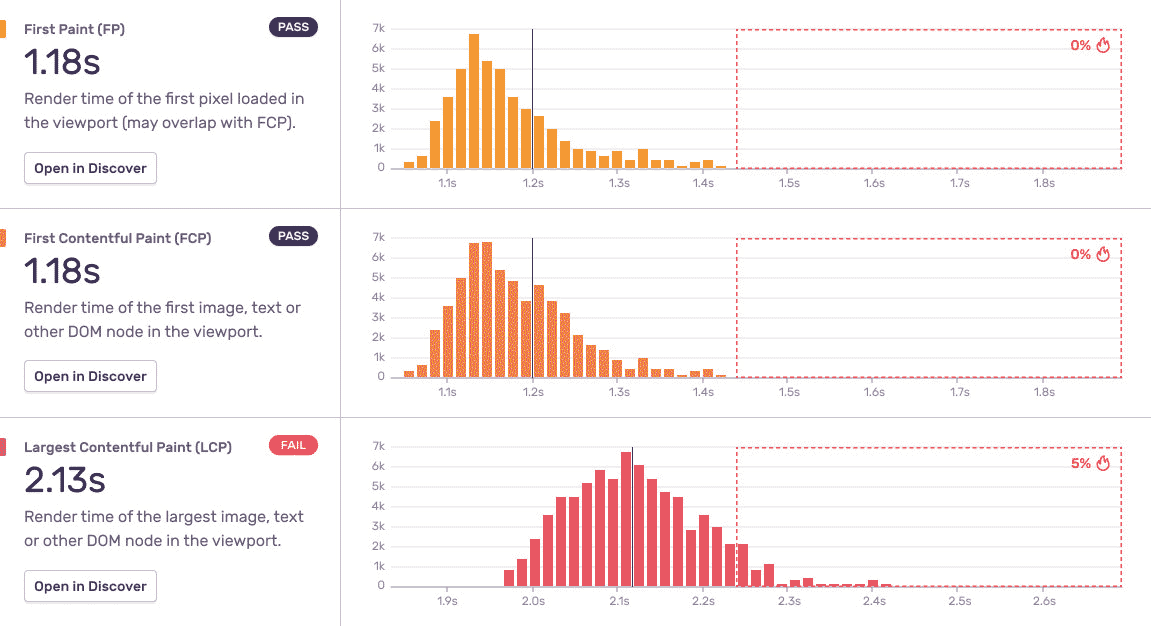
Sentry is a known service for tracking errors in your software, but they are improving every day. Since 2020 they support a new feature, performance monitoring. Within your current Sentry environment (hosted as a SaaS or self-hosted/on-premise) you can track real user experience.
- Measure web vitals
- Untangle tracing
- Prove improvement
Take a look at Sentry performance monitoring.
Boomerang
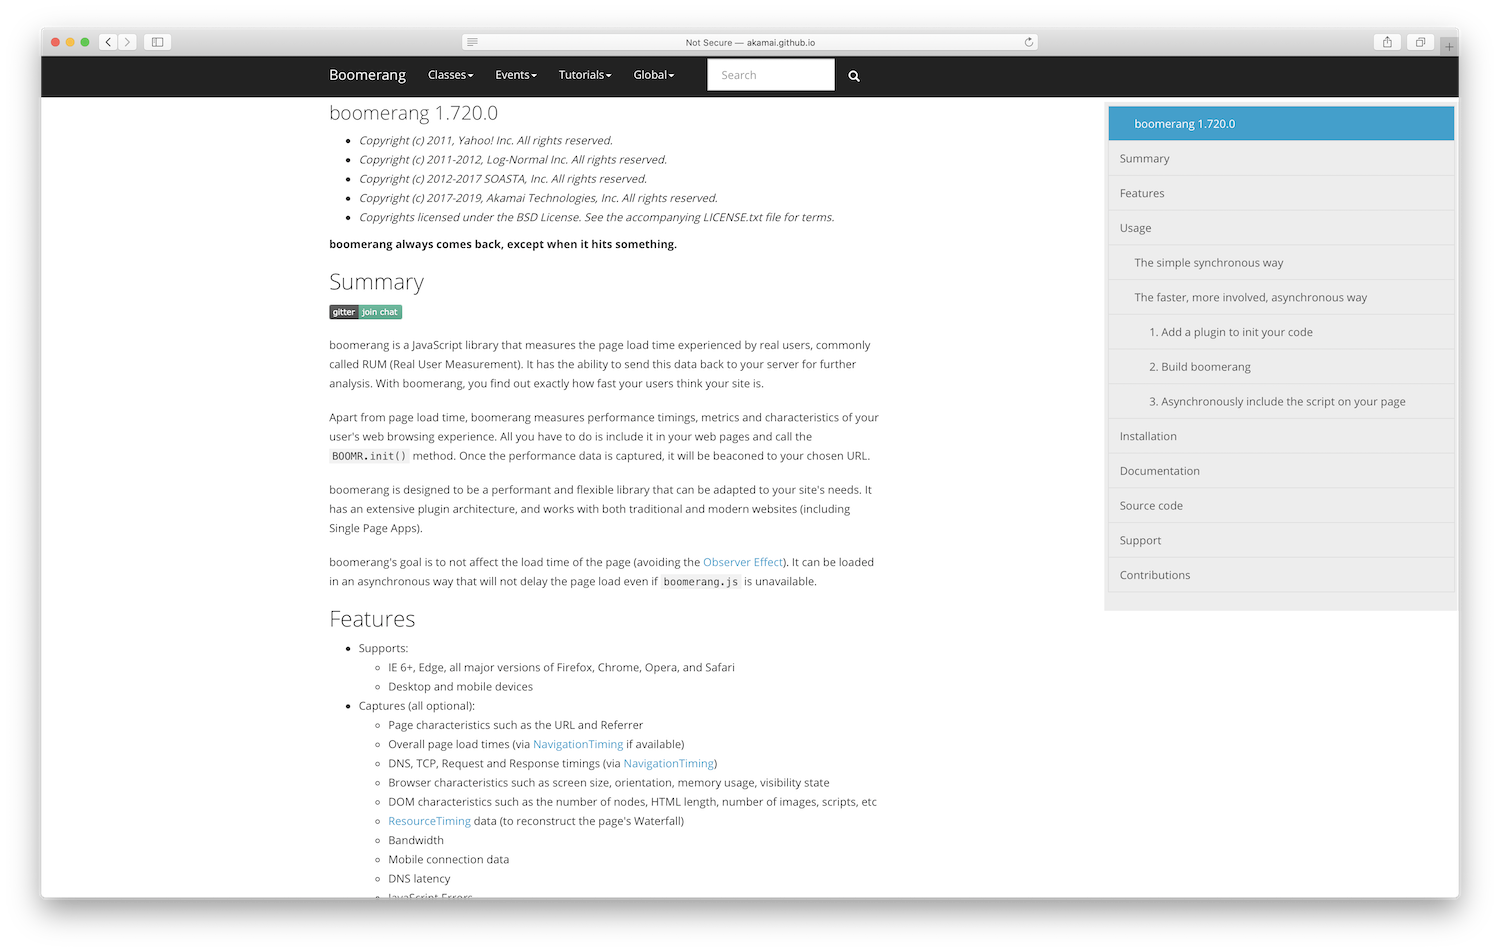
Boomerang is a JavaScript library that measures the page load time experienced by real users. It can send this data back to your server for further analysis.
Boomerang is, as mentioned, only a library that collects the data and sends it via a beacon to your back-end. Therefore, you have to make your data collection server/analysis tool.
Supports:
- IE 6+, Edge, all major versions of Firefox, Chrome, Opera, and Safari
- Desktop and mobile devices
Captures (all optional):
- Page characteristics such as the URL and Referrer
- Overall page load times
- DNS, TCP, Request and Response timings
- Browser characteristics
- DOM characteristics such as the number of nodes
- ResourceTiming data
- Bandwidth
- Mobile connection data
- DNS latency
- JavaScript Errors
- XMLHttpRequest instrumentation
- Third-Party analytics providers IDs
- Single Page App interactions
Take a look at Boomerang.
Catchpoint
Information is coming soon...
Rapidspike
Information is coming soon...
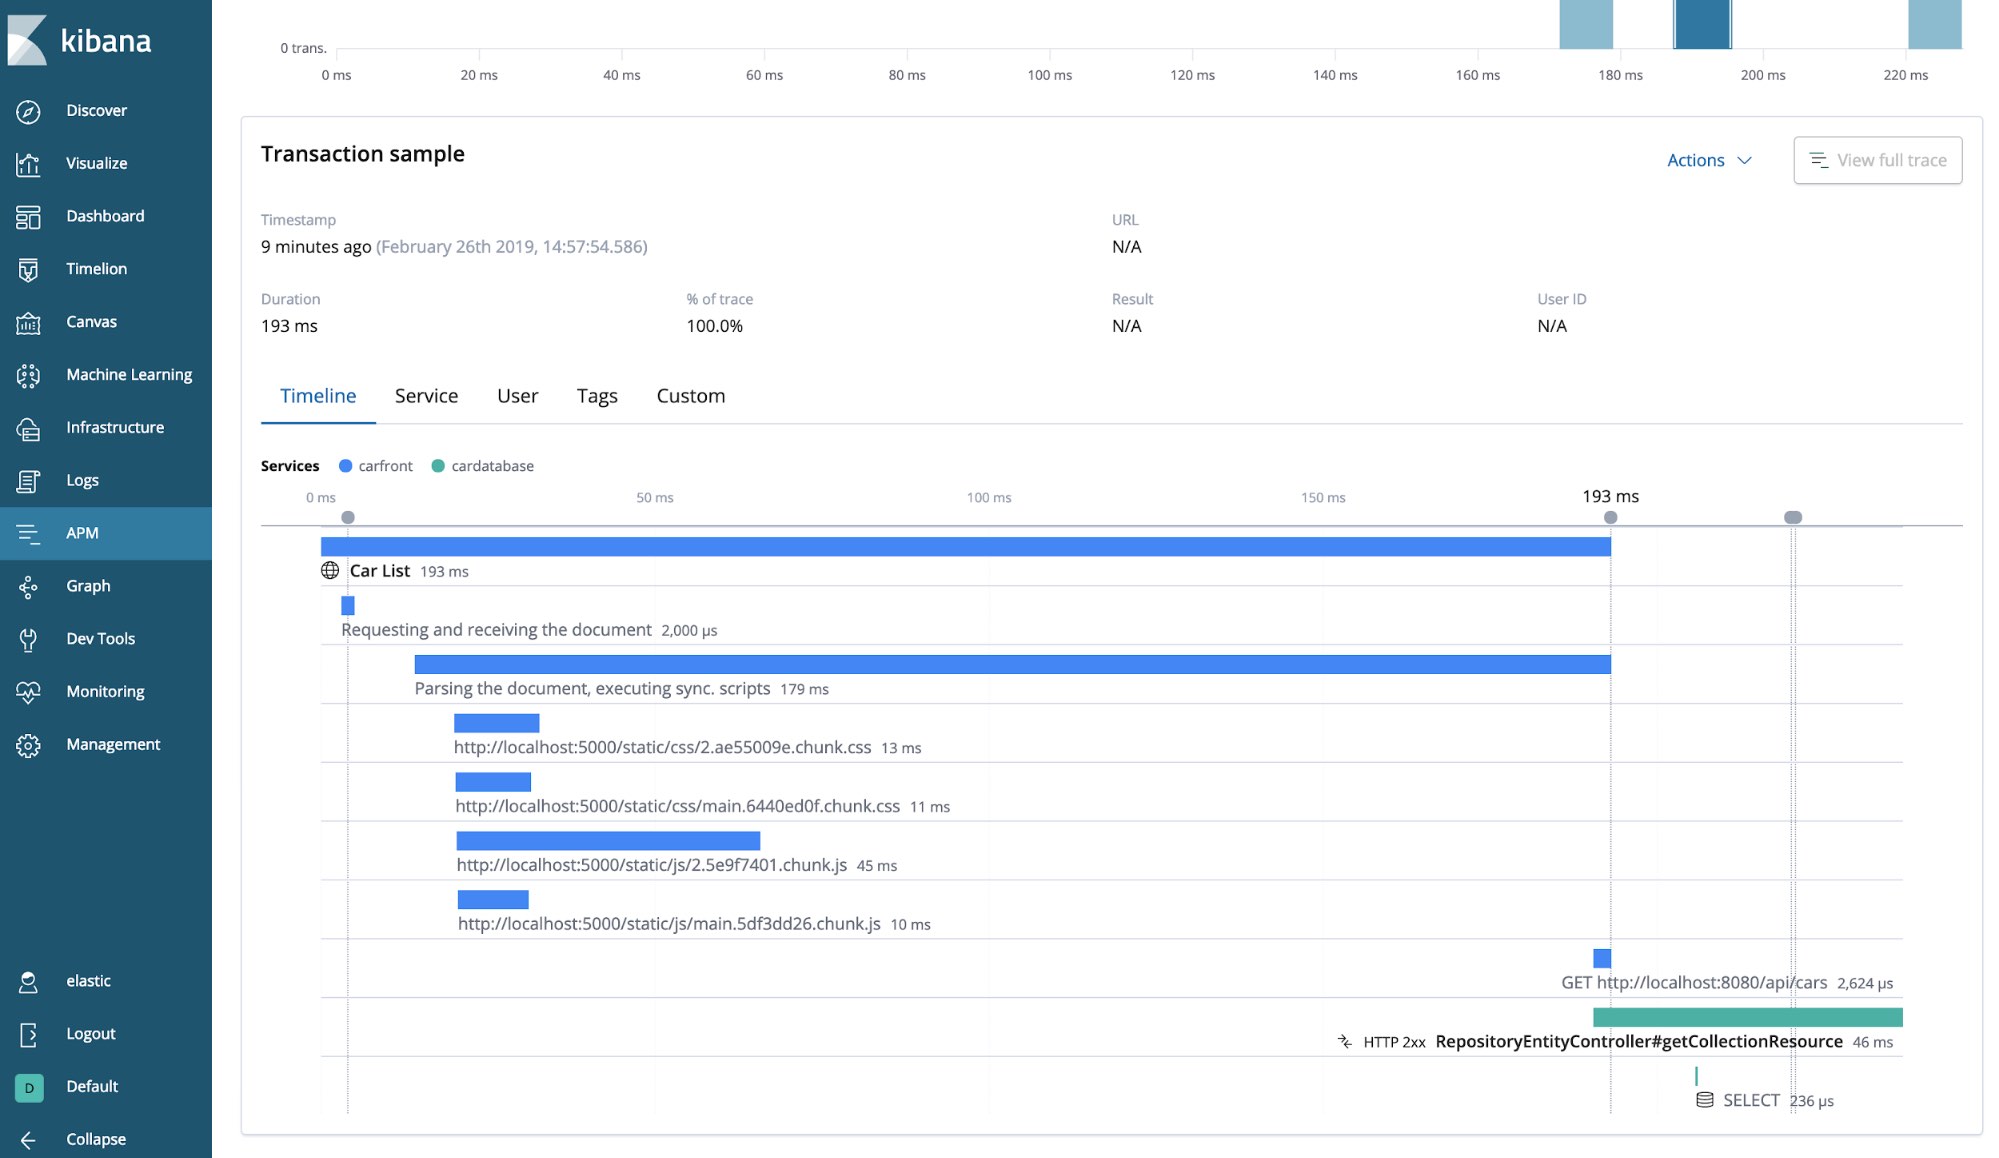
Elastic
Elastic is known for its fast database services (called Elasticsearch). When you have a large dataset it's easy to use Elastic and get fast results.
- Page load breakdown
- Resource waterfall
- Location mapping
- Javascript errors
Take a look at Elastic.
LogRocket
More information about LogRocket with Real User Monitoring is coming soon...
Take a look at LogRocket.
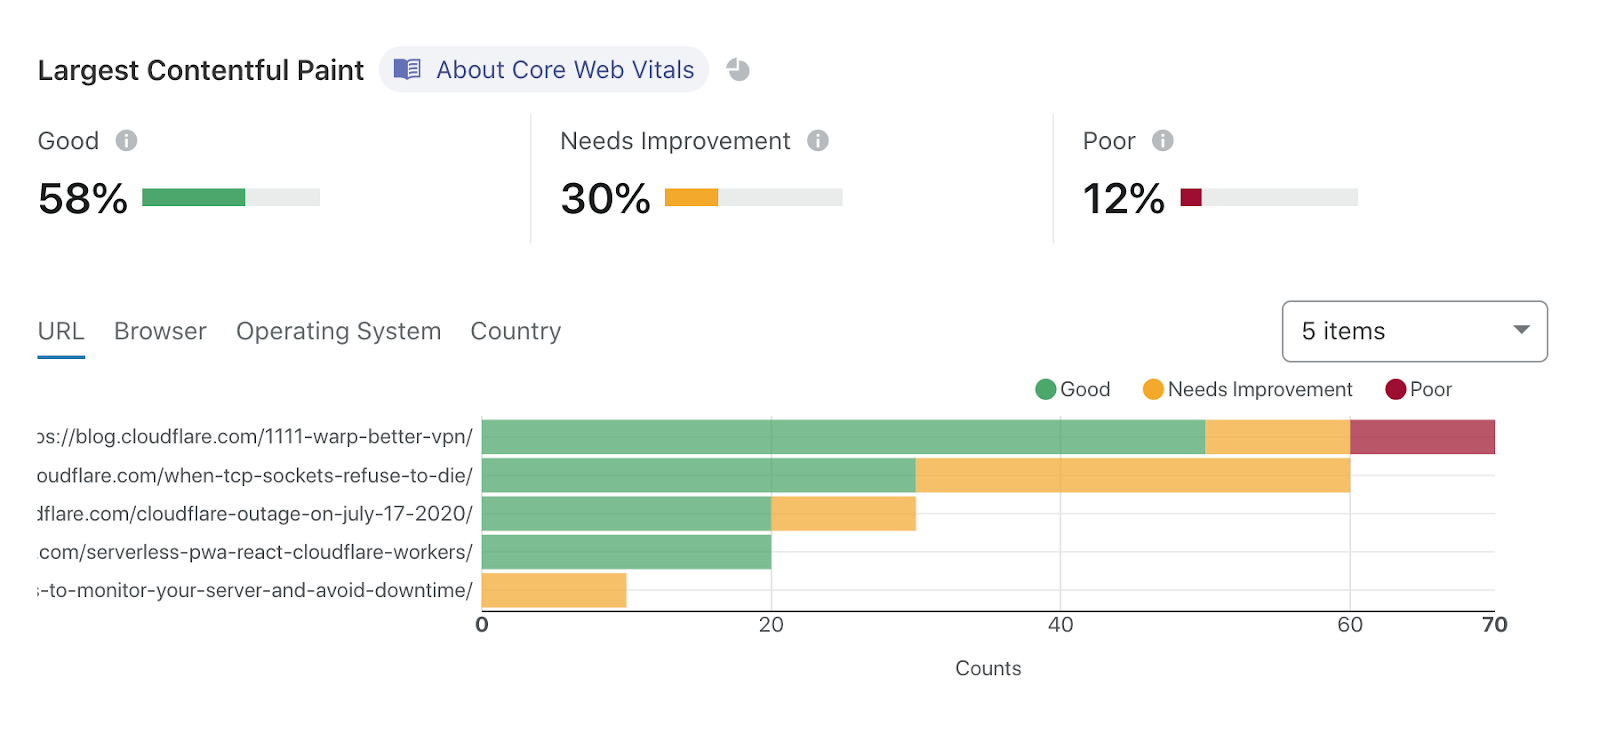
Cloudflare Browser Insights
Cloudflare launched in September 2019 a new tool, called Browser Insights. It's their tool for monitoring real users.
The data is coming from a percentage (10%) of your users, so it's not tracking all your visitors.
It's a free tool available for websites behind the Cloudflare Proxy. At the moment of writing it's not possible to use it as a standalone solution.
Note, since December 2020, there is a beta for measuring the user experience for websites that are not behind the Cloudflare Proxy. You can manually add a snippet to your website to measure the user experience.
Take a look at the blog post by Cloudflare Browser Insights and Cloudflare Analytics.
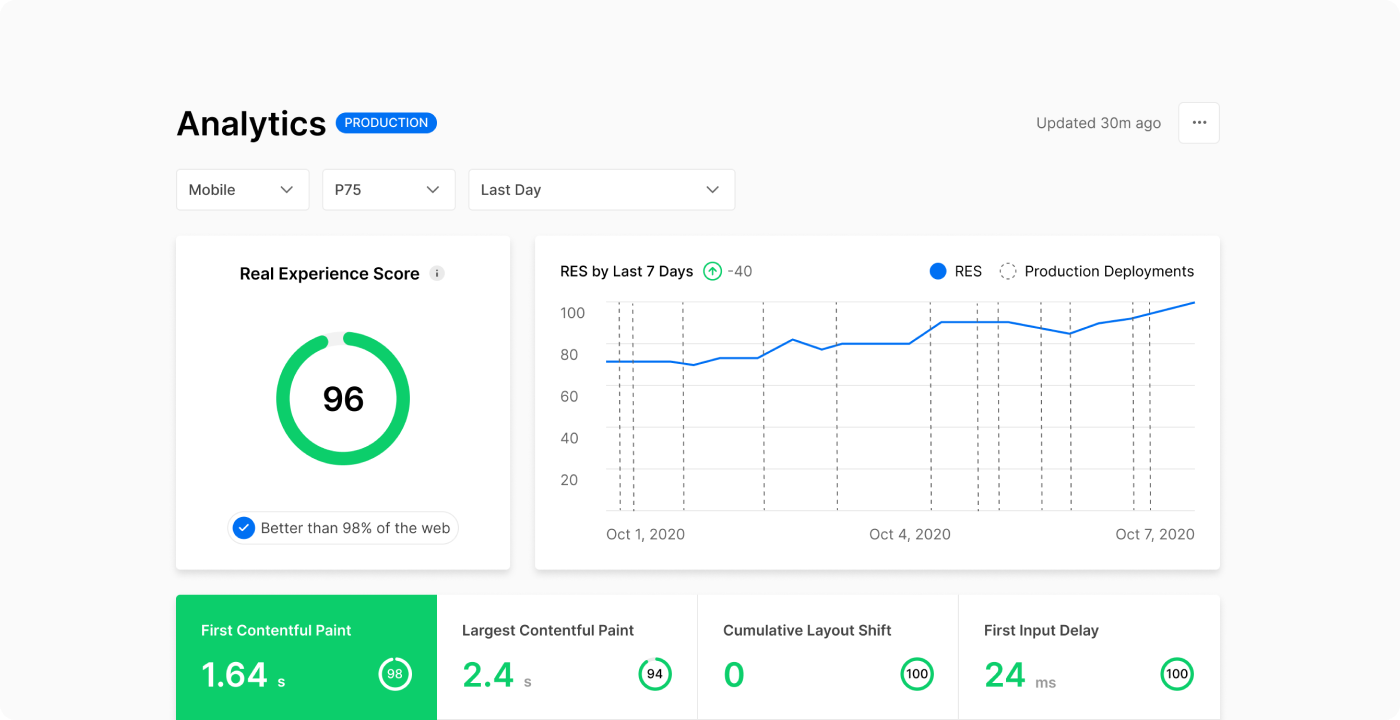
Vercel Analytics
With Vercel Analytics you can track the Real Experience Score.
- Does your website load fast?
- Is your website responsive?
- Is your website visually stable?
To use Vercel Analytics you can collect 100 data points per day for free. After that, you need to upgrade to a pro plan. Therefore you will be charged $10 USD each month + $0.65 USD per 10,000 data points you collect using Vercel Analytics.
Take a look at the Vercel Analytics documentation.
